
ML Model Monitoring: Boosting Performance & Reliability
In the dynamic realm of recommendation systems, the spotlight often shines on the development and deployment of models. Yet, the vital importance of ongoing model monitoring can sometimes fade into the background. This blog aims to uncover the crucial role that effective monitoring plays in guaranteeing the efficacy of ML models driving recommendation systems. As user preferences continually evolve, the relevance and impact of these models are sustained by the meticulous attention devoted to ensuring they run flawlessly.
In this blog post, our focus will center on the critical aspect of model monitoring. Using our own movie recommendation system as an example, we’ll delve into the intricacies of monitoring a model. Beyond mere implementation, the monitoring process constitutes an ongoing effort to ensure the system's performance, reliability, and relevance over time.
Why model monitoring matters: The case of our movie RecSys
What's our RecSys made of?
Our RecSys is an advanced movie recommender system implemented using TFRS (TensorFlow Recommenders) on the MovieLens 25M dataset, augmented with info from TMDB. This system adopts concepts from the 4-stage recommendation system comprising of a Retrieval model using the Two Tower model architecture, and a Ranking model. To represent movie features with accuracy and depth, RecSys integrates OpenAI embeddings, facilitating the discovery of similar items for enhanced personalization. You can check out more about the architecture here and test the system here.
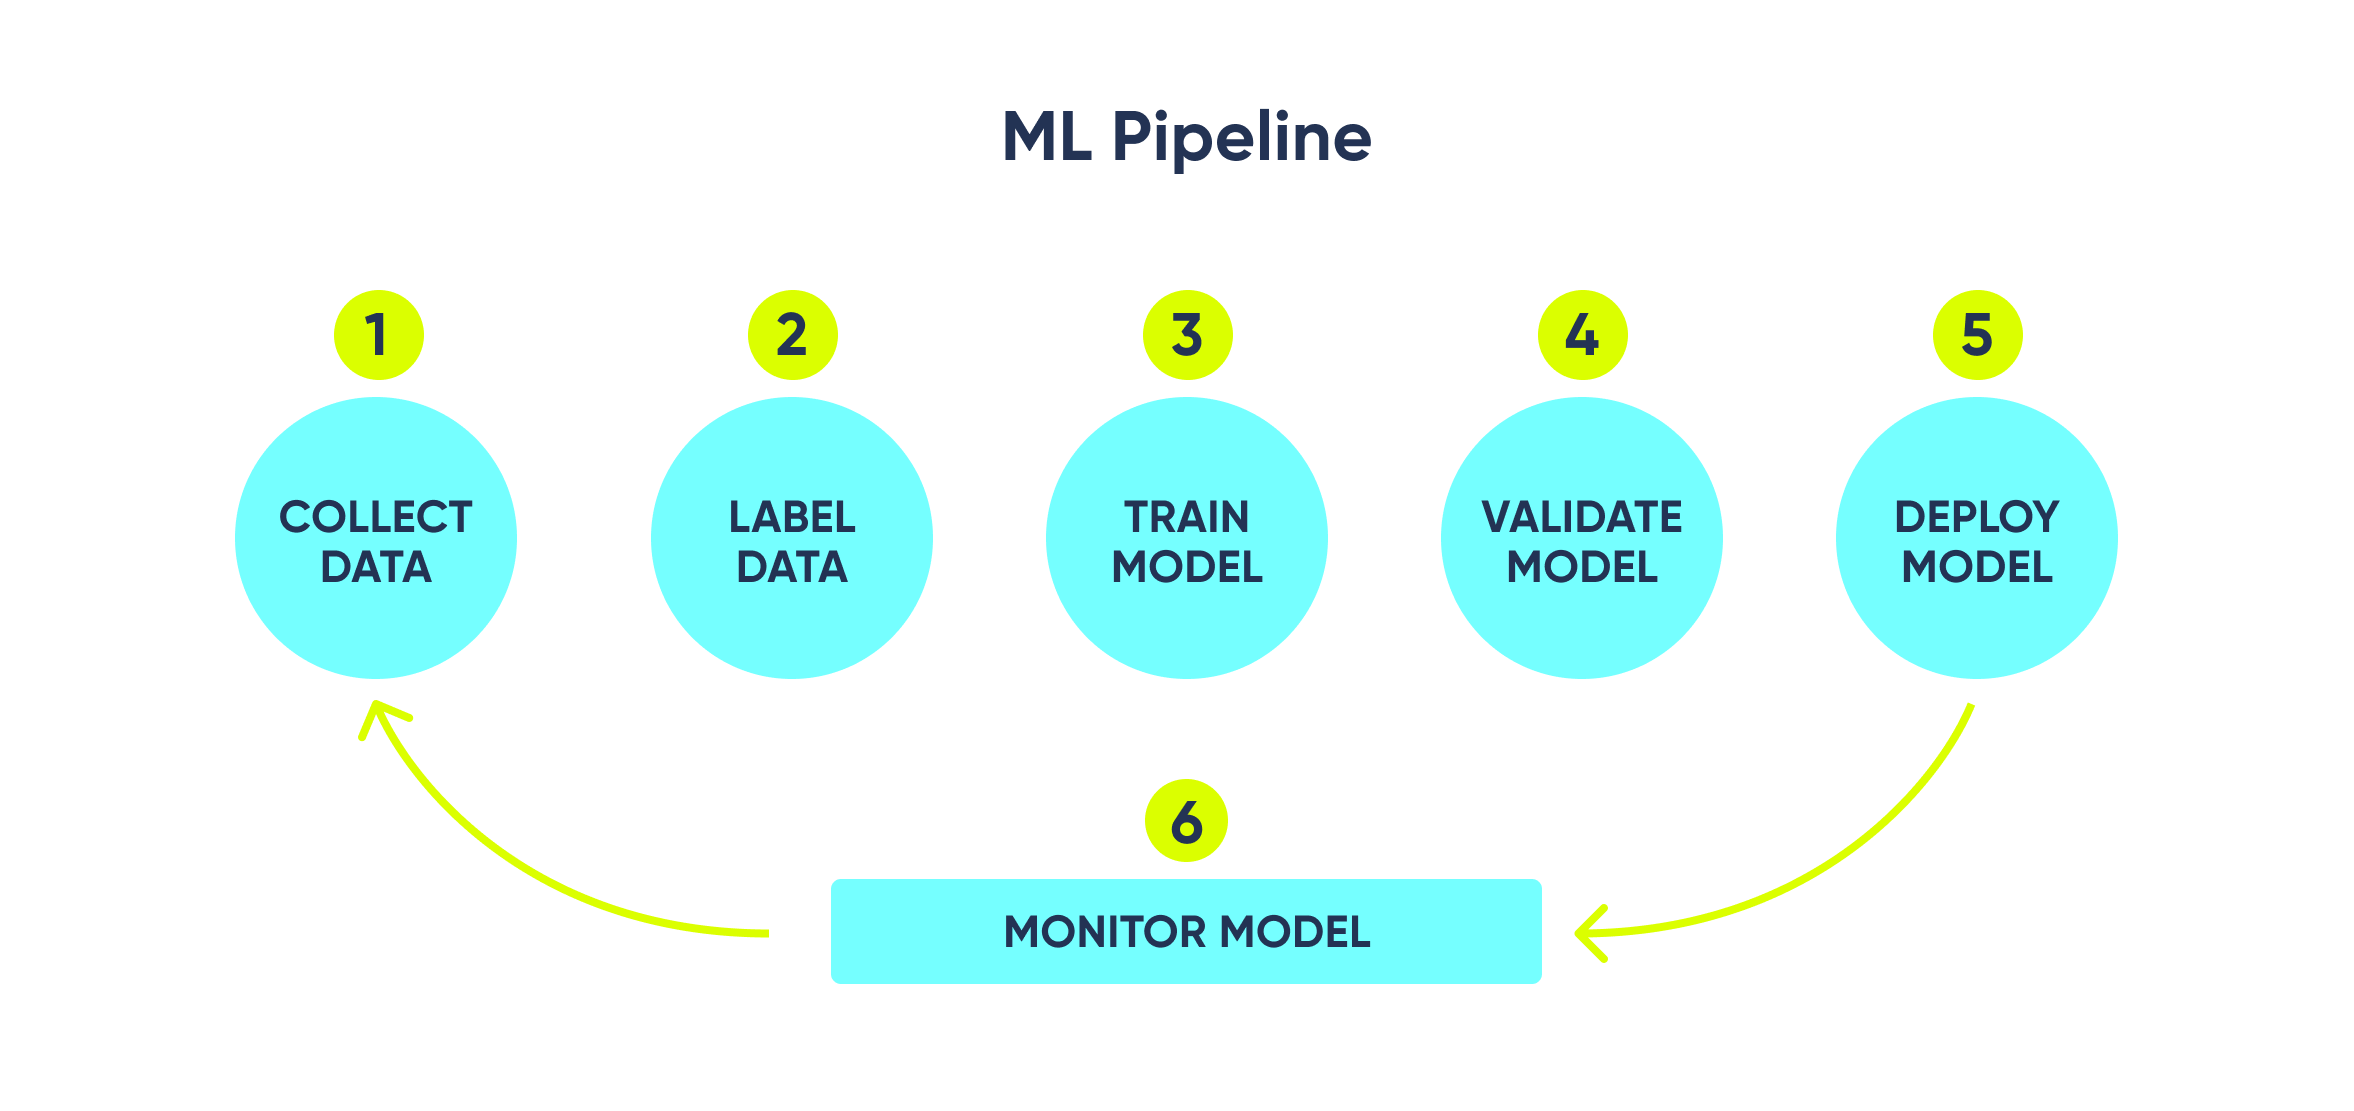
Why is it important to monitor a recommendation system?
Our main objective in monitoring this RecSys was to assess the model's performance by analyzing how users interact with the recommended content it generates. However, monitoring a machine learning system goes beyond this; it’s crucial to gain a dynamic understanding of how well the system performs over time.
By continuously monitoring this RecSys, we can identify any changes in its effectiveness as user preferences and behaviors evolve. This ongoing evaluation allows us to make the necessary improvements and ensure the system remains reliable and relevant.
Additionally, we sought to compare different recommendation sources, aiming to identify the most effective way to fill the recommendation list. We’ll discuss more about how we achieved this and give more details about the sources later.
In summary, by monitoring a RecSys, we gain:
✅ Increased user satisfaction: Monitoring recommendation systems is vital to ensure that users are receiving accurate and relevant recommendations. An inaccurate or poorly performing recommendation system can lead to frustration, decreased user satisfaction, and potentially drive users away from the platform.
✅ Performance improvement: Continuous monitoring allows engineers and data scientists to identify and address performance issues, fine-tune algorithms, and optimize the system to provide better recommendations over time. Regularly analyzing user feedback and engagement metrics helps in making data-driven improvements.
✅ Adaptability to changing user behavior: User preferences and behaviors change over time. Regularly monitoring recommendation system performance allows for quick adaptation to evolving user needs and preferences.
How to monitor a recommendation system
Choosing the correct tools and metrics
Selecting the right combination of tools and metrics is a critical step in effectively monitoring a recommendation system. The tools you choose should align with your system's requirements for data collection, analysis, visualization, and alerting. In the case of our movie recommender model, we opted for Prometheus and Grafana.
Prometheus and Grafana worked seamlessly for us, allowing efficient data collection, in-depth analysis, proactive anomaly detection, and visual presentation of results. However, it's essential to consider your existing infrastructure, data availability, and the complexity of metrics required when making these decisions. Whether you opt for these tools or alternative solutions, a well-designed monitoring approach will ensure that your recommendation system remains reliable, effective, and capable of adapting to evolving user needs.

Why we chose Prometheus and Grafana
- Efficient data collection with Prometheus: By integrating Prometheus, we were able to capture and analyze the vital data, enabling us to calculate custom metrics and understand how well our model was truly performing.
- Alerting and anomaly detection: Monitoring an ML model in production demands proactive detection of issues such as data drift, model degradation, or infrastructure problems. Both Prometheus and Grafana offered built-in support for alerting based on predefined thresholds. With this feature, we could promptly detect any anomalies or performance deviations, triggering alerts to notify our team.
- Grafana visualization: Grafana, a powerful visualization tool, proved to be the perfect complement to Prometheus. Its user-friendly and customizable dashboarding experience allowed us to create comprehensive visualizations of the monitoring data. Grafana's extensive support for Prometheus integration ensured seamless data flow and simplified the overall monitoring process.
When/why not to use Prometheus or Grafana
- You already have the data: If you've collected and stored the required data in a suitable format and need to visualize and analyze it, Grafana can be directly linked to your existing dataset, enabling you to build dashboards and alerts without extra data collection from Prometheus.
- Alternative monitoring solutions: In some cases, you might be using a cloud-based suite or a monitoring platform that comes with integrated monitoring and dashboarding capabilities. If your current solution adequately meets your monitoring needs and provides essential metrics, it may not be necessary to introduce Prometheus and Grafana into your setup.
- PromQL learning curve: While Prometheus offers powerful querying capabilities through PromQL, mastering this query language might require time and effort.
Exploring metrics for model monitoring: Metrics selection and implementation
Metrics selection
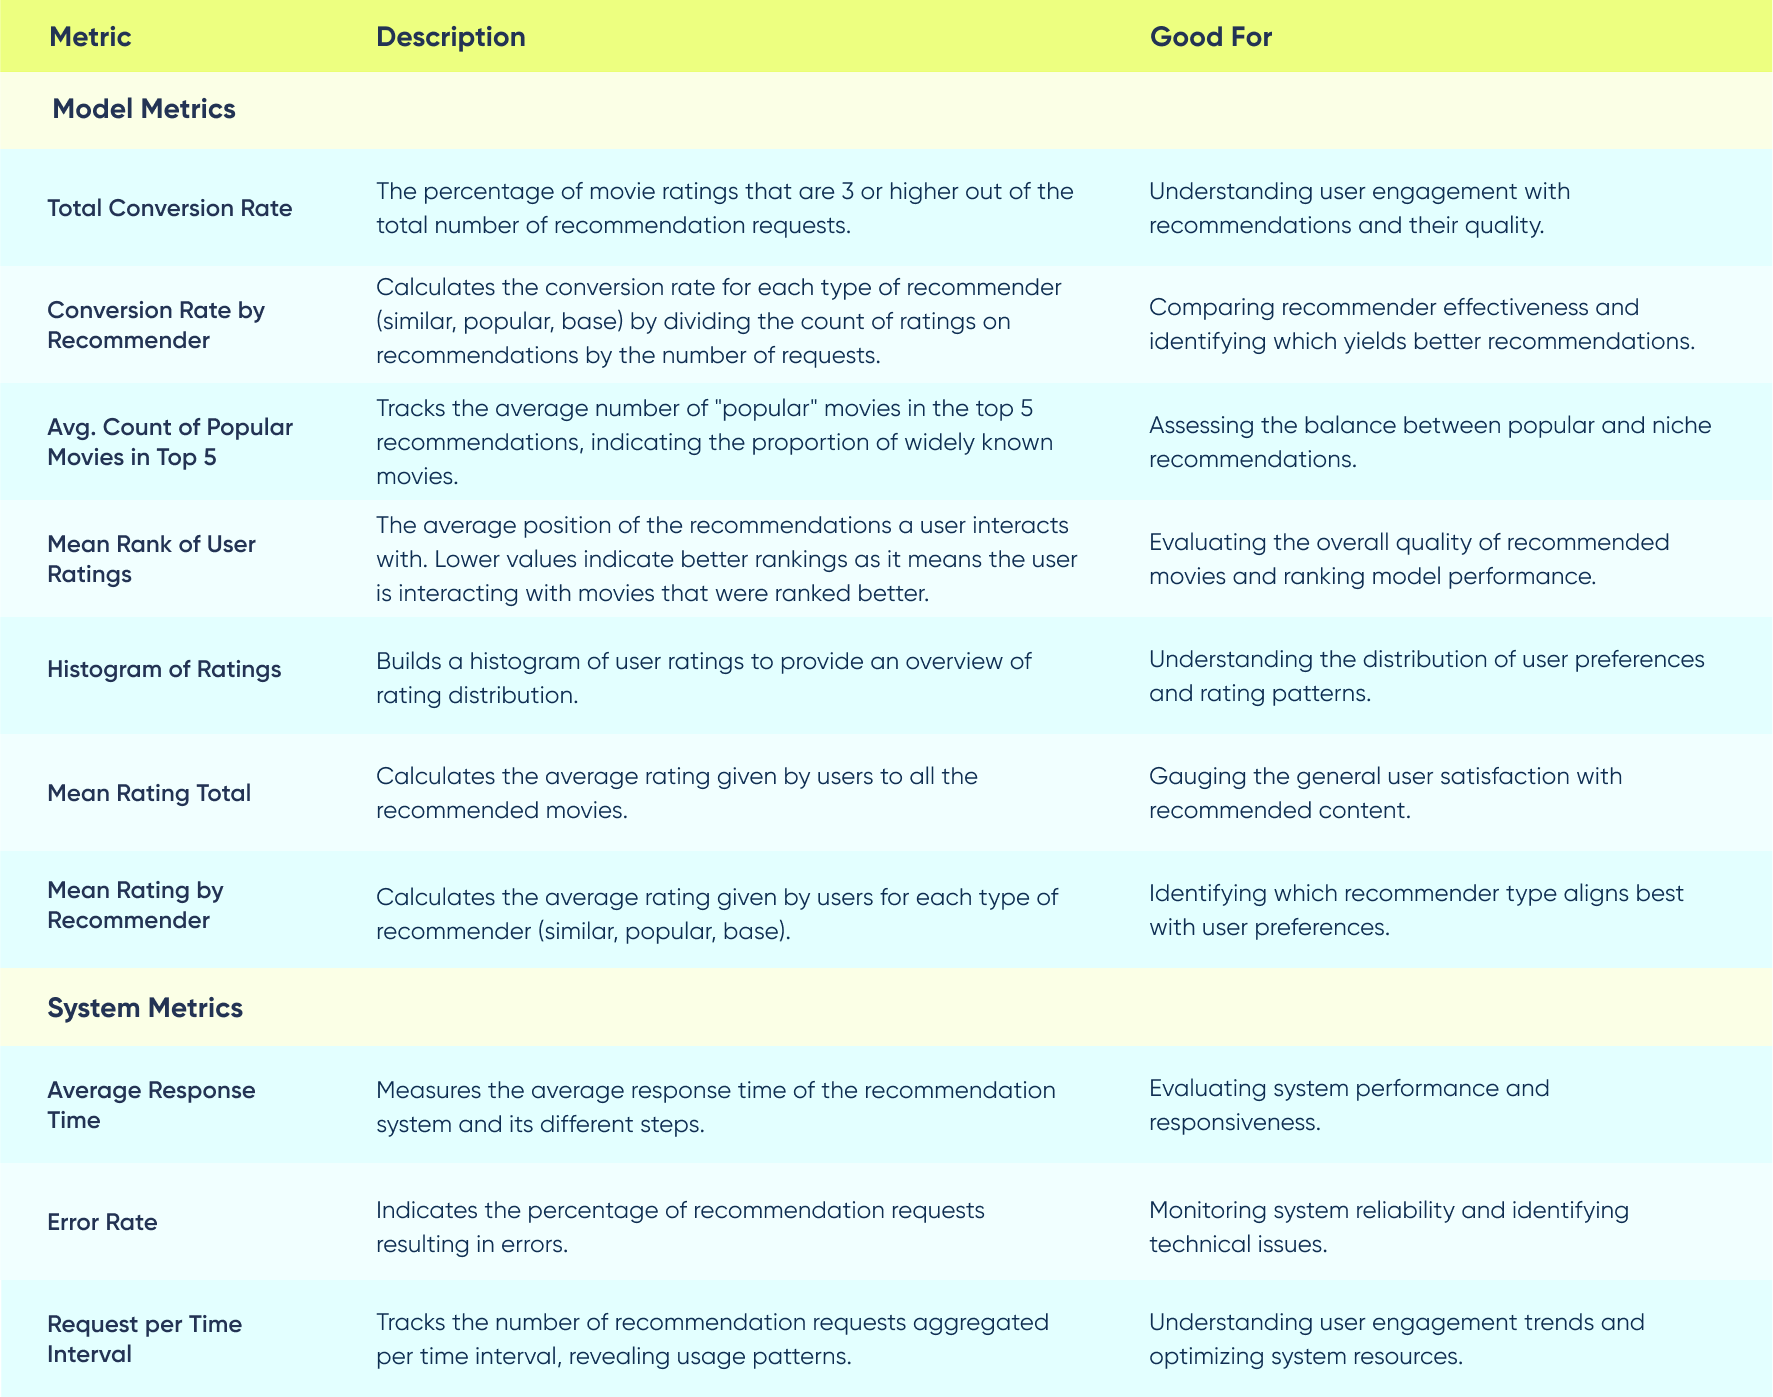
In our movie recommender model, we aimed to gain a deep understanding of how well our recommendations were serving users. To achieve this, we selected a set of metrics that covered various aspects of the recommendation process, including user interactions, recommendation quality, and system performance. These metrics allowed us to evaluate the effectiveness of different recommendation sources in our system, which consisted of three main types: "similar," "popular," and "base.”:
- Similar Recommender: The "similar" recommender utilized OpenAI embeddings to discover movies similar to those that users had previously rated or interacted with.
- Popular Recommender: The "popular" recommender focused on recommending movies that were currently trending or widely popular among users. The average count of popular movies in the top 5 recommendations allowed us to gauge the balance between popular and niche movie recommendations.
- Base Recommender: The "base" recommender is our two-tower retrieval model.
Implementation
Prometheus metrics
Prometheus supports four main types of metrics, each serving a specific purpose for collecting and representing data. These metric types are used to measure different aspects of your system's performance and behavior. Let's explore each of the Prometheus metric types and how we made use of them:
-
Counter:
- A counter is a monotonically increasing value that represents a cumulative total. It is typically used to track the number of occurrences of an event or the total number of items processed.
- Counters can only increase or be reset to zero, making them suitable for metrics that continuously accumulate, such as the total number of movie recommendations made to users.
- Example:
count_in_top5 = Counter('count_in_top5', 'Count of items in top 5', labelnames=['recommender'])counter increments whenever a movie from a specific recommender is included in the top 5 recommendations. This way, we can monitor how frequently movies from each recommender are recommended in the top 5 and assess how the ranking model prefers the different recommendation sources.
-
Gauge:
- A gauge is a value that can go up and down over time. It represents a snapshot of a particular value at a given moment.
- Gauges are useful for monitoring metrics that can vary independently, such as the current number of active users, CPU utilization.
-
Histogram:
- A histogram samples observations and counts them into configurable buckets. It also provides a sum of observed values and the count of observations.
- Histograms can be used to analyze the distribution of user feedback ratings for recommended movies.
- Example:
Histogram('user_rating', 'Histogram of user ratings by value', labelnames=['recommender'], buckets=[1, 2, 3, 4, 5])This histogram metric categorizes user feedback ratings (e.g., 1 to 5 stars) for movies recommended by all three sources
-
Summary:
- A summary is similar to a histogram but provides quantiles instead of buckets. It calculates the 0%, 25%, 50%, 75%, 90%, 95%, 99%, and 100% quantiles of observed values.
- Summaries are useful for monitoring metrics with varying distribution percentiles, such as response times, allowing you to analyze performance across different percentiles.
- Example:
rank_smr = Summary('item_rank', 'Summary of item ranks', labelnames=['recommender'])This summary is designed to track the ranks(position) of the rated movies by users. By using this summary, we can observe how the ranks are distributed across the various recommenders in the system.
Logging metrics with Prometheus
- Histogram of user ratings by value: By building a histogram, we categorize user ratings into different buckets, such as 1, 2, 3, 4, and 5 stars. The histogram reveals the distribution of ratings across these buckets.
- Summary of item ranks: The summary metric provides both a count of rated items and the sum of their ranks. This way, we can get the average of a timeframe.
- Counter of items in the top 5: The counter increments whenever a movie from a specific recommender is included in the top 5 list.
Grafana dashboarding
In our continuous efforts to effectively monitor the performance and reliability of our recommendation system, we used the power of Grafana to create three distinct dashboards.
Each dashboard serves a purpose, contributing to a comprehensive view of both system-level and model-specific metrics. These dashboards, accompanied by strategic color-coded thresholds, allow us to swiftly identify potential issues, track user experience, and delve into detailed metrics for further analysis.
Also, all the dashboards have the ability to adjust the time interval for data visualization. This adaptability is made possible through the use of the
$__intervalvariable, which allows us to dynamically determine the timeframe under examination by modifying it in Grafana’s UI. By flexibly changing this interval, we can pinpoint precisely when deviations from expected values occurred, aiding in the rapid identification and troubleshooting of issues.Main dashboard: it’s the cornerstone of our monitoring strategy. Drawing inspiration from the RED method advocated by Grafana’s documentation, this dashboard is designed to provide an instant overview of the user experience.
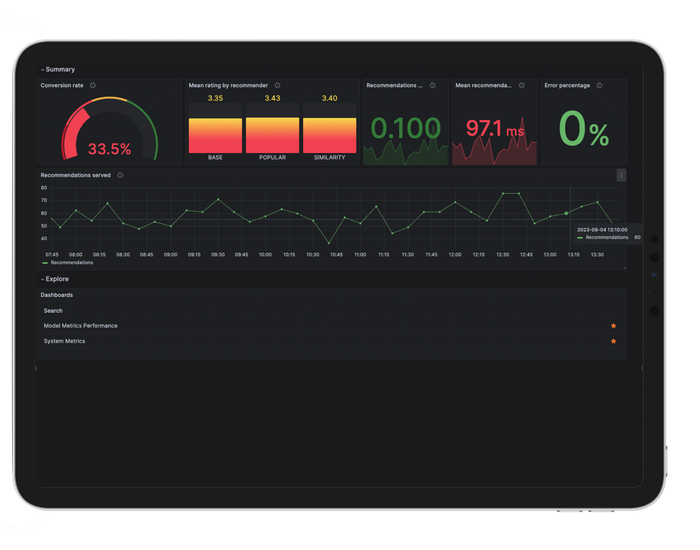
Color-coded thresholds of red for critical, yellow for warnings, and green for optimal values intuitively guide our attention. This quick visual assessment informs us of potential symptoms or deviations from normalcy. Should any anomaly be detected, this dashboard acts as a launchpad, providing seamless navigation to more detailed metrics for deeper analysis.
Let’s dive into the different panels and metrics we developed to achieve this:
- Conversion rate: To represent the conversion rate, we use a Gauge panel as it’s a metric that can go up and down and can quickly show us how well users are interacting with the recommendations. To calculate it, we use the following PromQL query:
(sum(rate(user_rating_bucket{le=~"5.0|4.0|3.0"}[$__interval])))
/
sum(rate(http_requests_total{handler="/recommendations/", status="2xx"}[$__interval]))
This quantifies the sum of user ratings of 3 stars and above, divided by the total successful recommendation requests within the specified interval. Though not an exact conversion rate, it effectively gauges user satisfaction and interaction trends.
- Mean rating by recommender: In this case, we use a “Bar gauge” to represent the mean rating that each recommender gets for their recommendations. As we are logging the user ratings with Prometheus Summary, we can achieve this easily with the PromQL query
rate(user_rating_sum[$__interval])/rate(user_rating_count[$__interval])- Recommendations requests per second: Number of requests to recommendations endpoint in a timeframe.
- Mean recommendations request time: The mean latency to get recommendations.
- Error percentage: Number of requests to recommendations endpoint that errored by the total number of requests.
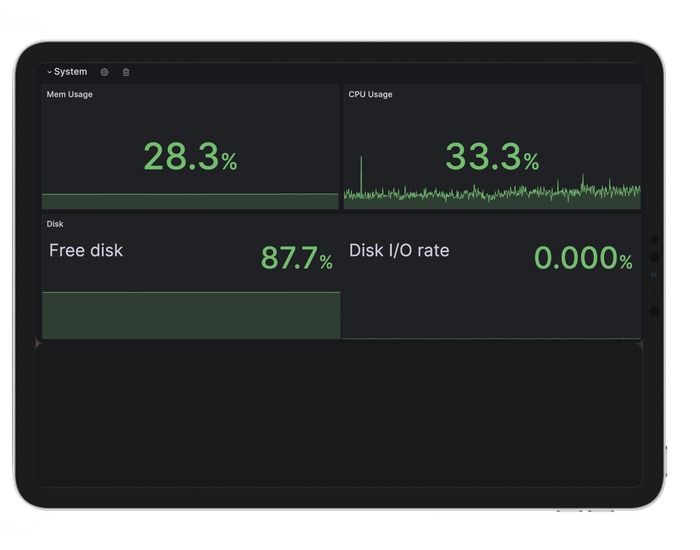
System Metrics Dashboard: it serves as a direct resource for addressing potential system-level concerns. Linked from the Main Dashboard, it presents a comprehensive view of resource utilization and response times.
In the event of anomalies highlighted in the Main Dashboard, quick navigation to this dashboard allows us to pinpoint underlying system issues efficiently.
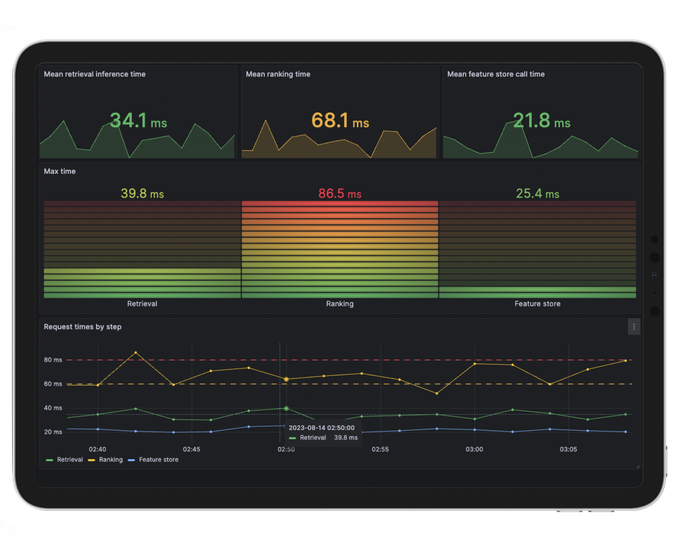
Model Metrics: this dashboard goes deeper into the performance and user interaction aspects of the recommendation system. Alongside familiar model metrics from the Main Dashboard, we introduce additional insights such as Mean Reciprocal Rank (MRR), rating distribution, and different recommendation source distribution. MRR is a metric we used during model training and validation, and therefore it is helpful to compute on the production system to compare and detect model drifts.

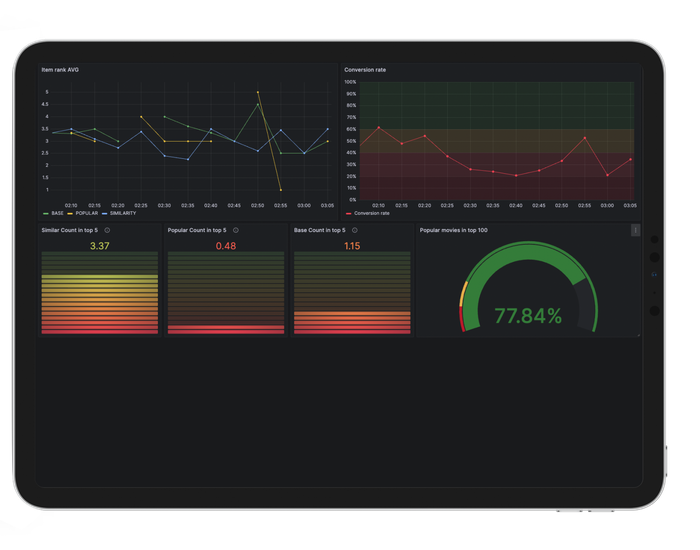
Moreover, it becomes a ground for detecting potential model drift, allowing us to set thresholds on MRR and Conversion Rate metrics. Should deviations be detected, the dashboard serves as a call to action, signaling the need for model updates or retraining.
Challenges and caveats
While our Grafana dashboards offer a powerful means of monitoring our recommendation system, several challenges and caveats deserve attention:
- Threshold setting: Establishing appropriate thresholds for both visualization and alerts to detect data and model drifts is a delicate task. Overly sensitive thresholds can lead to false positives, while conservative thresholds might delay issue detection. Continuous refinement is essential.
- Approximations and complex metrics: Complex metrics, while valuable, may require approximations for ease of logging. It's important to acknowledge that approximations can sometimes lead to incorrect conclusions. Rigorous validation and an understanding of the limitations are necessary when working with such metrics. Both MRR and conversion rates are approximations, as logging the exact metric would mean more effort from developers.
- Data interpretation complexity: Interpreting data from multiple panels and dashboards demands a solid understanding of the system's dynamics. Misinterpretation can lead to misguided actions and decisions.
- PromQL complexity: Constructing accurate PromQL queries for custom metrics may pose a challenge, particularly for users less familiar with Prometheus Query Language.
- Dashboard maintenance: Dashboards should evolve with the system. As the recommendation system and its usage patterns change, dashboard panels, and metrics may need updates to stay relevant and informative.
Conclusion: Lessons learned from Recsys
The case study of our movie recommender system exemplifies the importance of robust model monitoring in ensuring optimal performance and user satisfaction. Through this project, we've navigated the intricacies of monitoring, focusing on key aspects that enhance the overall reliability and effectiveness of our recommendation system.
However, we also found some obstacles and concerns. Selecting appropriate thresholds and dealing with approximations for complex metrics demanded careful consideration. The interpretation of data required a deep understanding of system dynamics, and constructing precise PromQL queries demanded a familiarity with Prometheus Query Language.
In conclusion, model monitoring requires continuous improvement and adaptation. As we developed our recommendation system, we recognized that monitoring isn't just about tracking metrics – it's about refining user experiences, optimizing performance, and staying resilient in the face of change.
If you're interested in optimizing your own rec system, our team can help you elevate your performance and overall user experience. Don't hesitate to reach out!


